Oracle 8i's Profiler analyzes PL/SQL code and locates bottlenecks. As you probably know, the first working version of your code is usually inefficient and slow. There is a way to measure its execution time on a line-by-line basis without using a profiler, but it's tedious and slow. It involves calling the GET_TIME function (from the Oracle-supplied DBMS_UTILITY package) before and after selected lines of code. That's primitive and inefficient because it requires adding multiple lines of temporary code and recompiling it. Plus you still don't know how many times each line gets executed without adding even more code.
The Problem
Because PL/SQL programming involves writing and using custom and Oracle-supplied
packages, as well as standalone procedures and functions, performance tuning
is an important task for Oracle developers. Checking code line by line
is slow and inefficient because it requires adding multiple lines of temporary
code and recompiling it.
Solution
Use the Oracle 8i Profiler to analyze PL/SQL code and locate bottlenecks.
Improving PL/SQL code performance is an iterative process:
1.Run the application code with profiler data collection
enabled.
2.Analyze the profiler data and identify performance
problems.
3.Fix the problems.
Using the DBMS_PROFILER Package
The Profiler API is implemented as a PL/SQL package, called DBMS_PROFILER.
This package provides services for collecting statistics related to the
execution of PL/SQL code and persistently storing it in three profiler
tables (PLSQL_PROFILER_DATA, PLSQL_PROFILER_RUNS, and PLSQL_PROFILER_UNITS)
in order to analyze the code and identify performance problems.
The DBMS_PROFILER package is not created by default by the database.
It must be generated by the ProfLoad.sql script. This script is supplied
with Oracle 8.1.6 and is located in the $ORACLE_HOME/Rdbms/Admin directory.
(It's not provided in version 8.1.5 but can be downloaded from technet.oracle.com.
OTN registration is required.) This script has to be executed by a SYS
or INTERNAL user, and access has to be granted to PUBLIC. This script calls
two other scripts, Dbmspbp.sql and Prvtpbp.plb, located in the same directory.
A typical profiling session consists of the following steps:
Start the profiler data collection.
Execute the PL/SQL code.
Stop the profiler data collection.
The Oracle 8i profiler gathers information at the PL/SQL virtual machine
level, which includes the total number of times each line has been executed,
the total amount of time that has been spent executing that line, and the
minimum and maximum times that have been spent on a particular execution
of that line.
Creating the Test Data and Stored Procedure
Listing 1 shows the necessary code for creating the table and stored
procedure, which I use in this article's examples. Let's create the TestData
table and TestProc stored procedure to use in our profiling sessions.
Listing 1. Code for the TestData Table and TestProc Stored Procedure.
The red line is line 18, which is analyzed in Figure 2 and compared to
line 16 in Listing 2.
DROP TABLE TestData CASCADE CONSTRAINTS;
CREATE TABLE TestData(
TestData_ID NUMBER(10) NOT NULL,
Name VARCHAR2 (30),
CONSTRAINT TestData_PK PRIMARY KEY (TestData_ID));
CREATE OR REPLACE PROCEDURE TestProc(
p_Count NUMBER) IS
TYPE t_Numbers IS TABLE OF NUMBER
INDEX BY BINARY_INTEGER;
v_Nums t_Numbers;
BEGIN
FOR n_Count IN 1..p_Count
LOOP
v_Nums(n_Count)
:= n_Count;
END LOOP;
FOR n_Count IN 1..p_Count
LOOP
INSERT INTO
TestData (TestData_ID, Name)
VALUES ( v_Nums(n_Count),
'Profiler Test ' || TO_CHAR(v_Nums(n_Count)));
END LOOP;
COMMIT;
DBMS_OUTPUT.PUT_LINE('Procedure TestProc: ' || TO_CHAR(p_Count)
|| ' rows created in TestData table.');
EXCEPTION
WHEN OTHERS THEN
ROLLBACK;
END TestProc;
/
Profiling with TOAD
I'm using TOAD (Tool for Oracle Application Developers) version 6.5.0.0
from Quest Software, Inc., to profile this TestProc stored procedure. Oracle
doesn't have a graphic profiling tool of its own. You can download a free
trial version of TOAD from the Quest Web site.
To use the profiler in TOAD:
1 - Start TOAD and select Database > PL/SQL Profiling to turn on the profiler, or click the Toggle PL/SQL Profiling button in the main TOAD toolbar. The icon for the button is a stopwatch.
2 - Execute the procedure TestProc from the Schema Browser or the Procedure
Editor using the Execute (lightning bolt) button. You will be prompted
to enter a value for the p_Count IN parameter (10000) and a description
of the procedure being executed ("TOAD, TestProc Run 1 - 12/19/2000").
This will show up in the Profile Analysis window when you analyze the results.
You could run the procedure several times to get some data into the profiling
tables.
Make sure you truncate the TestData table before each run by issuing
the following SQL command:
TRUNCATE TABLE TestData;
Turn off profiling if you want at this point.
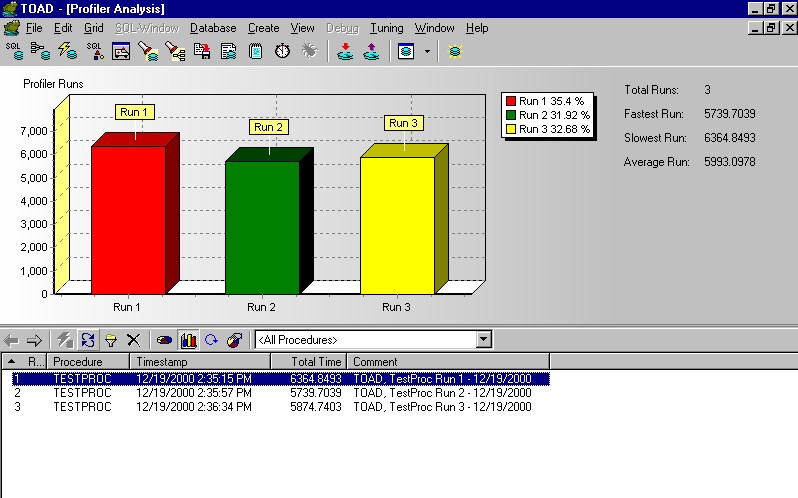
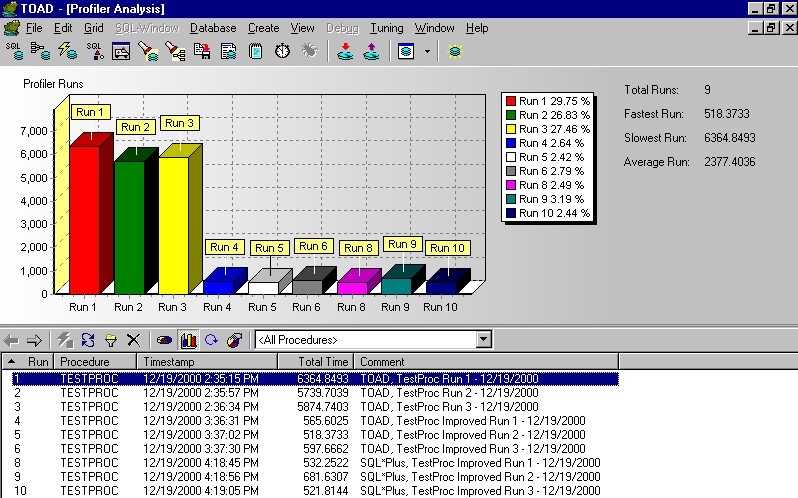
3 - Select Database > Profiler Analysis to bring up the Profiler Analysis window. There are three levels to the data. The top level represents the individual "Runs" of each procedure executed while profiling was enabled (see Figure 1 (The TOAD profiler analysis window shows three runs of the original procedure). )
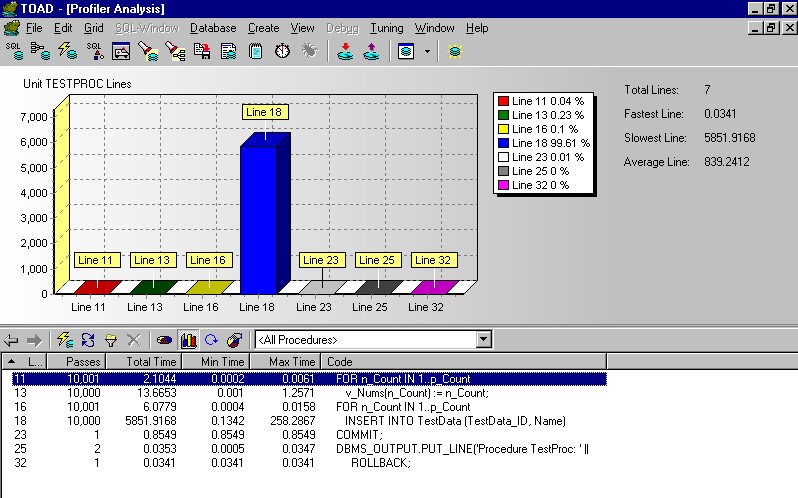
4 - Double-click on one item to see the execution stats for that individual run. At this level, you can double-click to see the line-by-line performance times for individual procedures called during the profiling (see Figure 2 Line-by-line analysis of TestProc original version, run 3. As you can see, line 18 took 99.61% of the total time to execute (10,000 passes, 5,852 ms. total). )
The Code column, where you are supposed to see actual PL/SQL code lines, was actually empty after the run completed. I had to create my own stored procedure, ProfilerLoadSource, and run it to fix this problem by populating the Code column with lines of source code. According to the Quest Software support, it works fine there; they could not reproduce the problem.
Let's improve this code by utilizing the FORALL statement that Oracle 8i introduced to support bulk binds
Replace the keyword FOR with FORALL and remove the LOOP and END LOOP statements, which are no longer needed because all 10,000 inserts will be passed to the SQL engine in one step. Listing 2 shows the improved version of TestProc.
Listing 2. An improved version of the TestProc stored procedure. The
red line is line 16, which is analyzed in Figure 4 and compared to line
18 in Listing 1.
CREATE OR REPLACE PROCEDURE TestProc(
p_Count NUMBER) IS
TYPE t_Numbers IS TABLE OF NUMBER INDEX BY BINARY_INTEGER;
v_Nums t_Numbers;
BEGIN
FOR n_Count IN 1..p_Count
LOOP
v_Nums(n_Count)
:= n_Count;
END LOOP;
FORALL n_Count IN 1..p_Count
INSERT INTO TestData (TestData_ID,
Name)
VALUES ( v_Nums(n_Count),
'Profiler Test ' || TO_CHAR(v_Nums(n_Count)));
COMMIT;
DBMS_OUTPUT.PUT_LINE('Procedure TestProc: ' || TO_CHAR(p_Count)
|| ' rows created in TestData table.');
EXCEPTION
WHEN OTHERS THEN
ROLLBACK;
END TestProc;
/
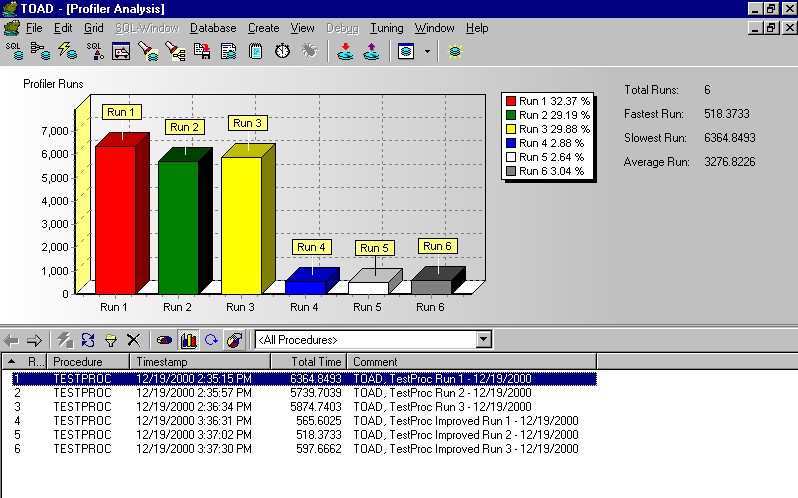
Let's use TOAD to profile an improved version of the TestProc stored procedure. Figure 3 (An improved version of the TestProc stored procedure, runs 46. ) shows the results of the next three runs. As you can see, the improved TestProc executes 10 to 12 times faster (average time 0.56 sec.) than the original one (average time 5.99 sec.).
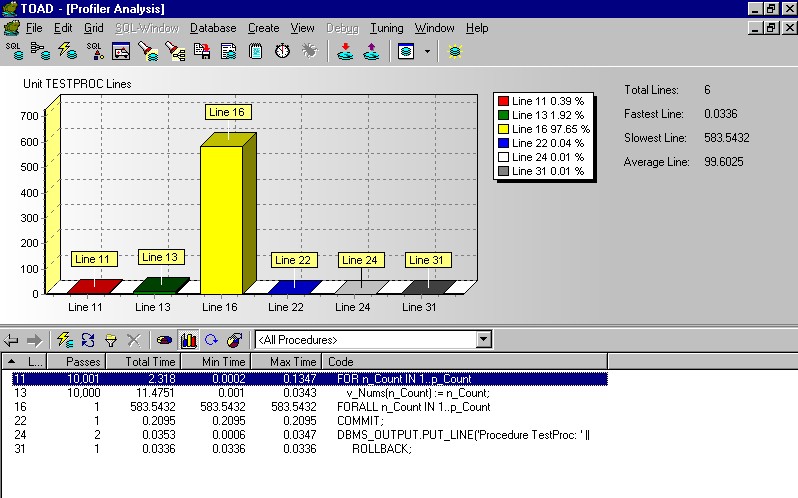
As Figure 4 A line-by-line analysis
of the improved TestProc, run 6. Line 16 was executed only once instead
of 10,000 times and it took only 584 ms. instead of 5,852 ms., as line
18 did in the original TestProc line-by-line analysis.) shows, line
16 in the improved TestProc was executed only once instead of 10,000 times
and it took only 584 ms. instead of 5,852 ms., as line 18 did in the original
TestProc.
Profiling with SQL*Plus
So far the runs have been made with TOAD. There are situations, however,
where you'll want to start a profiling process outside of TOAD in order
to control the profiling session morefor instance, by profiling multiple
procedures in batch mode, opening multiple SQL*Plus sessions and running
profilings in parallel, etc. With TOAD you are limited to one instance
of the program running and one procedure profiling at a time.
To profile outside of TOAD, you need to do TOAD's work by yourself:
1 - Add a wrapper around the procedure call, utilizing the START_PROFILER
and STOP_PROFILER procedures of the DBMS_PROFILER package.
2 - Insert additional code to calculate totals, load source code, and
do the cleanup.
I created the stored procedures ProfilerUnitsTotals (Listing
3) and ProfilerLoadSource (Listing 4) to do
the second item. You may consider creating your custom profiling package
where you can put these procedures and add more utilities later.
After doing this, you can use TOAD's nice graphic profiling interface,
even though you will be running your procedure from SQL*Plus.
Listing 3. The ProfilerUnitsTotals procedure
code.
CREATE OR REPLACE PROCEDURE ProfilerUnitsTotals(
p_RunId IN INTEGER,
p_ProcedureName VARCHAR2 DEFAULT 'Unknown') IS
CURSOR UnitsTotalCursor (p_Id BINARY_INTEGER) IS
SELECT Unit_Number AS UnitNumber, SUM(Total_Time) AS
UnitTimeTotal
FROM PLSQL_Profiler_Data
WHERE RunId = p_Id
GROUP BY Unit_Number;
BEGIN
IF NVL(p_RunId, 0) > 0 THEN
FOR v_ProfilerUnitsRec
IN UnitsTotalCursor(p_RunId)
LOOP
UPDATE
PLSQL_Profiler_Units
SET Total_Time = v_ProfilerUnitsRec.UnitTimeTotal
WHERE RunId = p_RunId
AND Unit_Number = v_ProfilerUnitsRec.UnitNumber;
END LOOP;
UPDATE PLSQL_Profiler_Runs
SET Run_User =
User,
Run_Proc = p_ProcedureName
WHERE RunId = p_RunId;
COMMIT;
ELSE
DBMS_OUTPUT.PUT_LINE('Parameter
value :' || TO_CHAR(p_RunId) || ' is invalid.');
END IF;
EXCEPTION
WHEN OTHERS THEN
DBMS_OUTPUT.PUT_LINE('Error
' || TO_CHAR(SQLCODE) || ': ' || SQLERRM);
END ProfilerUnitsTotals;
/
Listing 4. The ProfilerLoadSource procedure code.
CREATE OR REPLACE PROCEDURE ProfilerLoadSource(
p_RunId IN INTEGER DEFAULT NULL) IS
v_RunId INTEGER := 0;
CURSOR csr_LastRun IS
SELECT MAX(RunId)
FROM PLSQL_Profiler_Runs;
CURSOR csr_SourceLineCursor (p_Id BINARY_INTEGER) IS
SELECT D.Unit_Number, D.Line#, S.Text
FROM PLSQL_Profiler_Units U, PLSQL_Profiler_Data
D, User_Source S
WHERE U.RunId = D.RunId
AND U.Unit_Number = D.Unit_Number
AND U.Unit_Name
= S.Name
AND U.Unit_Type
= S.Type
AND D.Line#
= S.Line
AND U.RunId
= p_Id;
BEGIN
IF p_RunId IS NULL THEN
OPEN csr_LastRun;
FETCH csr_LastRun INTO v_RunId;
CLOSE csr_LastRun;
ELSE
v_RunId := p_RunId;
END IF;
IF NVL(v_RunId, 0) > 0 THEN
DELETE
FROM PLSQL_Profiler_Data
WHERE RunId = v_RunId
AND Total_Occur = 0;
FOR v_ProfilerSourceLine IN csr_SourceLineCursor(v_RunId)
LOOP
UPDATE PLSQL_Profiler_Data
SET Text = v_ProfilerSourceLine.Text
WHERE RunId = v_RunId
AND Unit_Number = v_ProfilerSourceLine.Unit_Number
AND Line# = v_ProfilerSourceLine.Line#;
END LOOP;
COMMIT;
ELSE
DBMS_OUTPUT.PUT_LINE('Parameter value
:' || TO_CHAR(v_RunId) || ' is invalid.');
END IF;
EXCEPTION
WHEN OTHERS THEN
DBMS_OUTPUT.PUT_LINE('Error
' || TO_CHAR(SQLCODE) || ': ' || SQLERRM);
END ProfilerLoadSource;
/
Start SQL*Plus, connect to the database as the same user connected via TOAD, and execute the PL/SQL anonymous block shown in Listing 5.
Listing 5. The PL/SQL code that profiles the TestProc stored procedure.
DECLARE
v_RunId INTEGER := 0;
v_Procedure VARCHAR2(30) := 'TestProc';
v_Procedure_Desc VARCHAR2(30) := ' Improved';
v_Run POSITIVE := 1;
v_App VARCHAR2(30) := 'SQL*Plus';
v_RunTitle VARCHAR2(2047) := v_App || ', ' || v_Procedure
|| v_Procedure_Desc || ' Run ' || TO_CHAR(v_Run) || ' - ' ||
TO_CHAR(SYSDATE, 'MM/DD/YYYY');
v_Comment VARCHAR2(2047) := 'Comment for ' || v_RunTitle
|| '.';
BEGIN
DBMS_PROFILER.START_PROFILER(v_RunTitle, v_Comment,
v_RunId);
DBMS_OUTPUT.PUT_LINE('Profiler Run ID: ' || TO_CHAR(v_RunId));
/* actual procedure for profiling executes here */
TestProc(10000);
DBMS_PROFILER.STOP_PROFILER();
ProfilerUnitsTotals(v_RunId, v_Procedure);
ProfilerLoadSource(v_RunId);
END;
/
Now you can look at the profiling data generated by SQL*Plus' runs via the graphical TOAD interface.
From (Figure 5: A line-by-line analysis of the improved TestProc, SQL*Plus runs 810) it's clear that all six runs of the improved version of TestProc (TOAD runs 46 and SQL*Plus runs 810) are 1012 times faster than the original version (runs 13). This happened because we were able to locate the problem (line 18) using the Profiler and solve it, with a consequent significant performance gain.
As you can see, Oracle 8i Profiler is a powerful tool that allows Oracle database developers to collect execution time statistics, identify bottlenecks, and tune PL/SQL code efficiently.